Learning to troubleshoot code in JavaScript is one of the most valuable skills you can build as a developer. Every project, from a simple landing page to a complex single-page application, will eventually produce bugs.
The difference between a frustrated developer and a productive one often comes down to having a reliable, repeatable process for finding and fixing those bugs. JavaScript's dynamic typing, asynchronous behavior, and browser-specific quirks make it especially prone to subtle errors that can eat hours of your time.
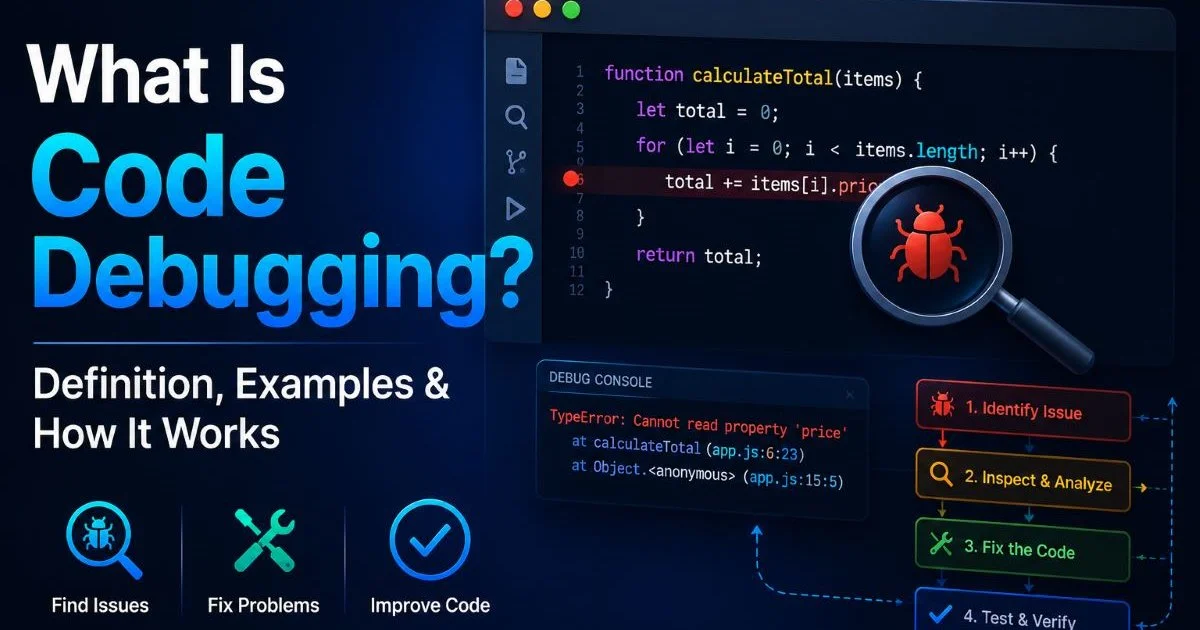
This guide walks you through a clear, step-by-step method to troubleshoot code effectively, so you spend less time guessing and more time shipping. Whether you're dealing with a silent failure in an event listener or a mysterious undefined in your console, these steps will help. If you're new to the broader concept, our guide on what code debugging is, with definitions and examples, provides a solid foundation before you start.
Key Takeaways
- Reproducing the bug consistently is always the first and most important step.
- Browser DevTools offer built-in breakpoints, watches, and network inspectors for free.
- Reading error messages carefully solves roughly half of all JavaScript bugs immediately.
- Isolating code into smaller pieces makes complex bugs manageable and testable.
- Writing a failing test before fixing a bug prevents the same issue from returning.

Step 1: Reproduce the Bug and Read the Error
Understand the Error Message
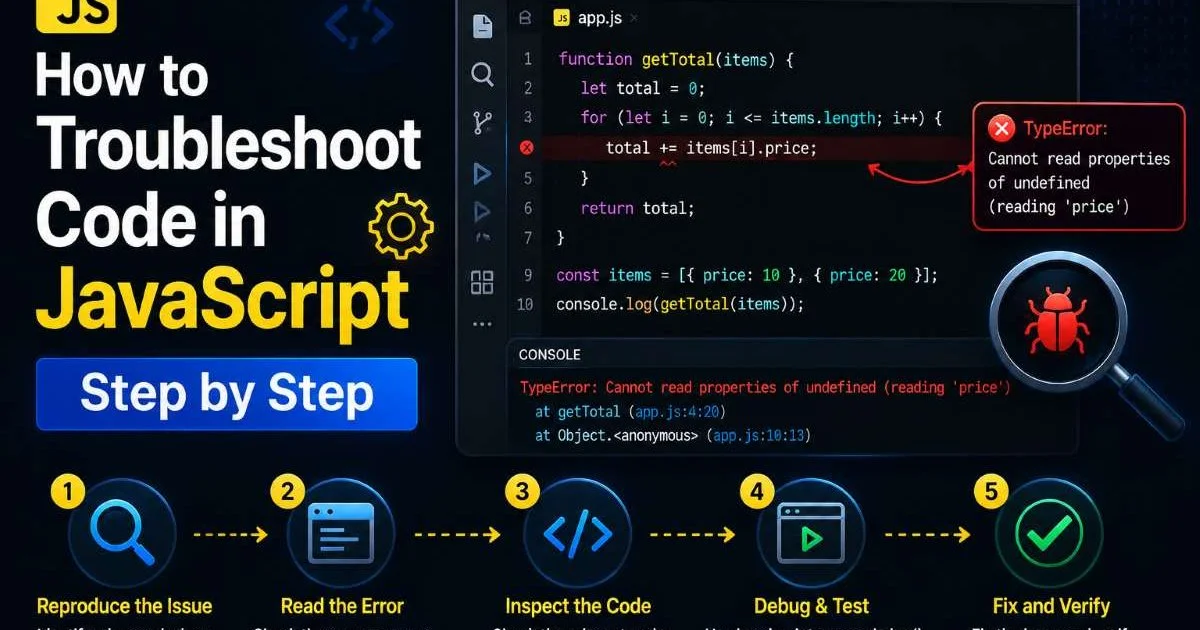
Before you change a single line of code, stop and read the error message. JavaScript error messages are more informative than most developers give them credit for. A TypeError: Cannot read properties of undefined (reading 'map') tells you exactly what happened: you called .map() on something that was undefined. The stack trace beneath it tells you where. Train yourself to read the full message, not just the first line. The file name, line number, and call stack are your starting coordinates.
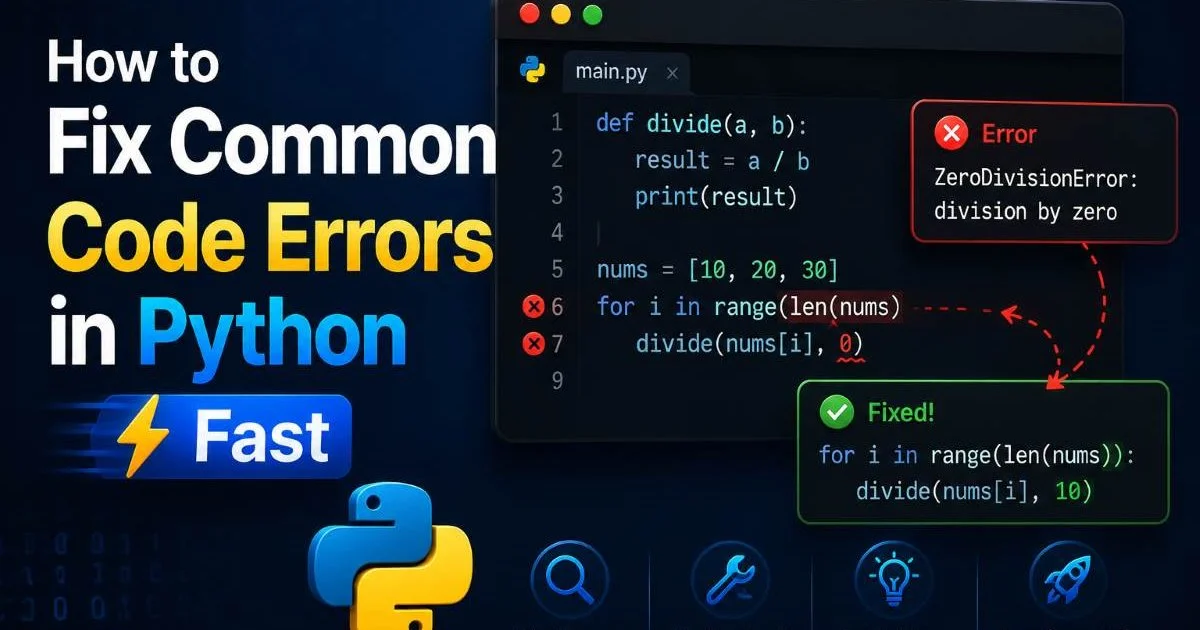
Common JavaScript errors fall into predictable categories. ReferenceError means a variable doesn't exist in scope. SyntaxError means the parser couldn't understand your code at all. TypeError usually means you're operating on the wrong data type. If you also work with Python, you'll find similar patterns in our article on how to fix common code errors in Python fast. Knowing these categories helps you form an instant hypothesis before you even look at the code.
Create Consistent Reproduction Steps
A bug you can't reproduce is a bug you can't fix with confidence. Write down the exact steps: which page, which button, which input values, which browser. If the bug is intermittent, note the conditions that seem to trigger it. Network latency, race conditions in async code, or specific user input lengths are frequent culprits. Aim to reduce your reproduction to the fewest steps possible. A three-step reproduction is far more useful than a vague "it sometimes crashes."
If you're working in a team, document these reproduction steps in your issue tracker. This alone saves hours of back-and-forth between developers, QA, and product managers. At the end of this step, you should have a clear error message (or a clear description of the incorrect behavior) and a reliable way to trigger the bug on demand.
Copy the full error message and stack trace into your notes before you start changing code. You'll want to reference it later.
| Error Type | Typical Cause | Example |
|---|---|---|
| ReferenceError | Variable not declared or out of scope | myVar is not defined |
| TypeError | Operation on wrong data type | Cannot read properties of null |
| SyntaxError | Invalid code structure | Unexpected token '}' |
| RangeError | Value outside allowed range | Maximum call stack size exceeded |
| URIError | Malformed URI functions | URI malformed |
Step 2: Isolate the Problem Area
Use Console Logging Strategically
Once you can reproduce the bug, your next job is narrowing down where it lives. The simplest tool is console.log(), but use it with intention. Don't scatter logs everywhere at random. Instead, place them at the boundaries of your suspected code: before and after function calls, at the top of event handlers, and right before the line that throws. Log variable values and types with typeof to catch those silent type coercion issues that JavaScript loves to create.
A more structured approach is to use console.table() for arrays and objects, console.group() to organize related logs, and console.trace() to print the call stack at any point. These methods turn your console from a firehose of text into a readable narrative. Remove all debugging logs before committing your code; leftover console.log statements in production are a code smell that reviewers will rightfully flag.
In production environments, consider using structured logging libraries like Winston or Pino instead of console.log. They provide log levels, timestamps, and can route output to monitoring services.
Binary Search Your Codebase
When the bug hides in a large function or a chain of callbacks, use a binary search approach. Comment out half the suspicious code and check if the bug still appears. If it does, the problem is in the remaining half. If it doesn't, the problem was in the code you removed. Repeat until you've narrowed it to a few lines. This technique works remarkably well for bugs in complex useEffect hooks in React or long Express middleware chains. It's methodical, and it prevents you from staring at code hoping inspiration strikes.
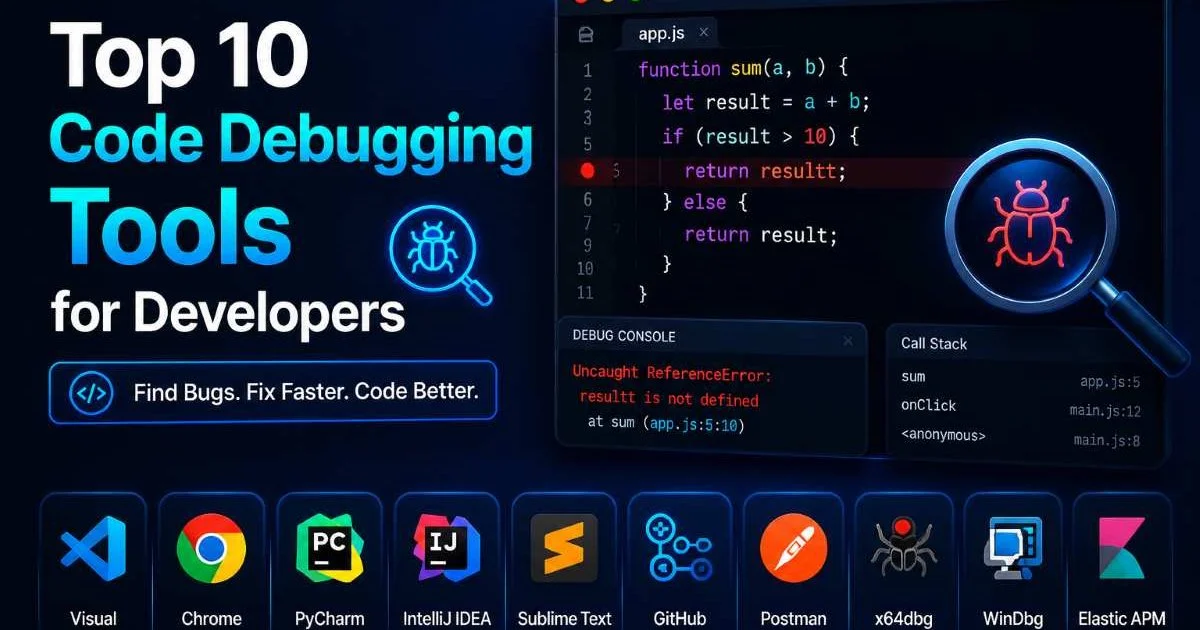
At the end of this step, you should know which function, module, or block of code contains the bug. You might even have a specific line or variable identified. The problem area should be small enough to reason about without scrolling. For a broader look at tools that help with this isolation process, check out our roundup of the top 10 code debugging tools for developers.
"The fastest way to find a bug in 500 lines of code is to eliminate 250 lines at a time."
Step 3: Use DevTools and Breakpoints to Troubleshoot Code
Setting Breakpoints in Chrome DevTools
Console logging is great for quick checks, but breakpoints give you a far more powerful way to troubleshoot code in JavaScript. Open Chrome DevTools (F12 or Cmd+Shift+I), navigate to the Sources panel, and click on the line number where you want execution to pause. When the code hits that line, the entire execution freezes. You can inspect every variable in scope, examine the call stack, and step through code one line at a time using "Step Over" (F10), "Step Into" (F11), and "Step Out" (Shift+F11).
Conditional breakpoints are especially useful. Right-click a line number and select "Add conditional breakpoint," then type an expression like userId === null. The debugger will only pause when that condition is true. This is invaluable when your function gets called thousands of times but only fails for specific inputs. You can also set breakpoints on DOM mutations, XHR requests, and event listeners directly from the DevTools panel, which eliminates guesswork entirely.
Use the "Watch" panel in DevTools to track specific variables across multiple breakpoints without adding console.log statements.
Inspecting Network Requests and Async Code
Many JavaScript bugs stem from API calls returning unexpected data. The Network tab in DevTools shows every request, its status code, headers, and response body. Click any request to inspect the full payload. If your code expects an array but the API returns an object (or an error HTML page), you'll see it immediately. Filter by XHR/Fetch to cut through the noise of image and stylesheet requests. Pay close attention to timing; a 408 timeout or a CORS error in the console can explain behavior that seems completely unrelated at first glance.
Async debugging requires special attention. Use the "Async" checkbox in the call stack panel to see the full chain of async/await or Promise calls that led to the current breakpoint. For complex workflows involving multiple API calls, consider using async stack traces, which Chrome enables by default. If you're building tools that rely on APIs or no-code platforms, understanding these async patterns is equally relevant; the best no-code AI agent builder platforms often handle similar async orchestration under the hood.
Step 4: Fix, Verify, and Prevent Regressions
Apply the Minimal Fix
Now that you know exactly where and why the bug occurs, resist the urge to refactor the entire module. Apply the smallest possible fix that addresses the root cause. If a variable is undefined because an API response changed shape, add a null check or update the data mapping. If a callback fires before data is loaded, move the call inside the promise chain. Small, targeted fixes are easier to review, test, and revert if something goes wrong. A targeted fix is also faster to get into production safely, which is a topic we cover in our guide on how to fix bugs in production code safely.
Test your fix against your original reproduction steps. Does the bug disappear? Good. Now test the surrounding features. Did you accidentally break something else? Check edge cases: what happens with empty arrays, null values, very long strings, or rapid repeated clicks? This verification step catches secondary bugs before they reach users. Many developers skip this and create a whack-a-mole cycle where every fix introduces a new problem.
Never commit a fix you haven't tested against the original reproduction steps. "It looks right" is not verification.
Write a Regression Test
The final piece is writing a test that would have caught this bug. Using Jest, Mocha, or Vitest, write a test case that mimics the exact conditions that triggered the failure. Run it, confirm it fails against the old code (or at least validates the fix), and then add it to your test suite. This regression test acts as a permanent guard. If anyone changes code in that area later, the test will break and flag the issue immediately. Teams that do this consistently see their bug recurrence rates drop significantly.
Consider also adding type safety through TypeScript or JSDoc annotations if the bug was caused by unexpected types. For projects with licensing dependencies, maintaining proper open source compliance is part of the long-term health of your codebase; a practical guide on how to build an open source license policy fast can help streamline that process. At the end of this step, your bug is fixed, verified across edge cases, and protected by an automated test. Your codebase is now more resilient than it was before the bug appeared.
Frequently Asked Questions
?How do I set a breakpoint in Chrome DevTools for async code?
?Is console logging or breakpoints faster for isolating bugs?
?How long should reproducing a JavaScript bug realistically take?
?Can a TypeError always be fixed by checking for undefined first?
Final Thoughts
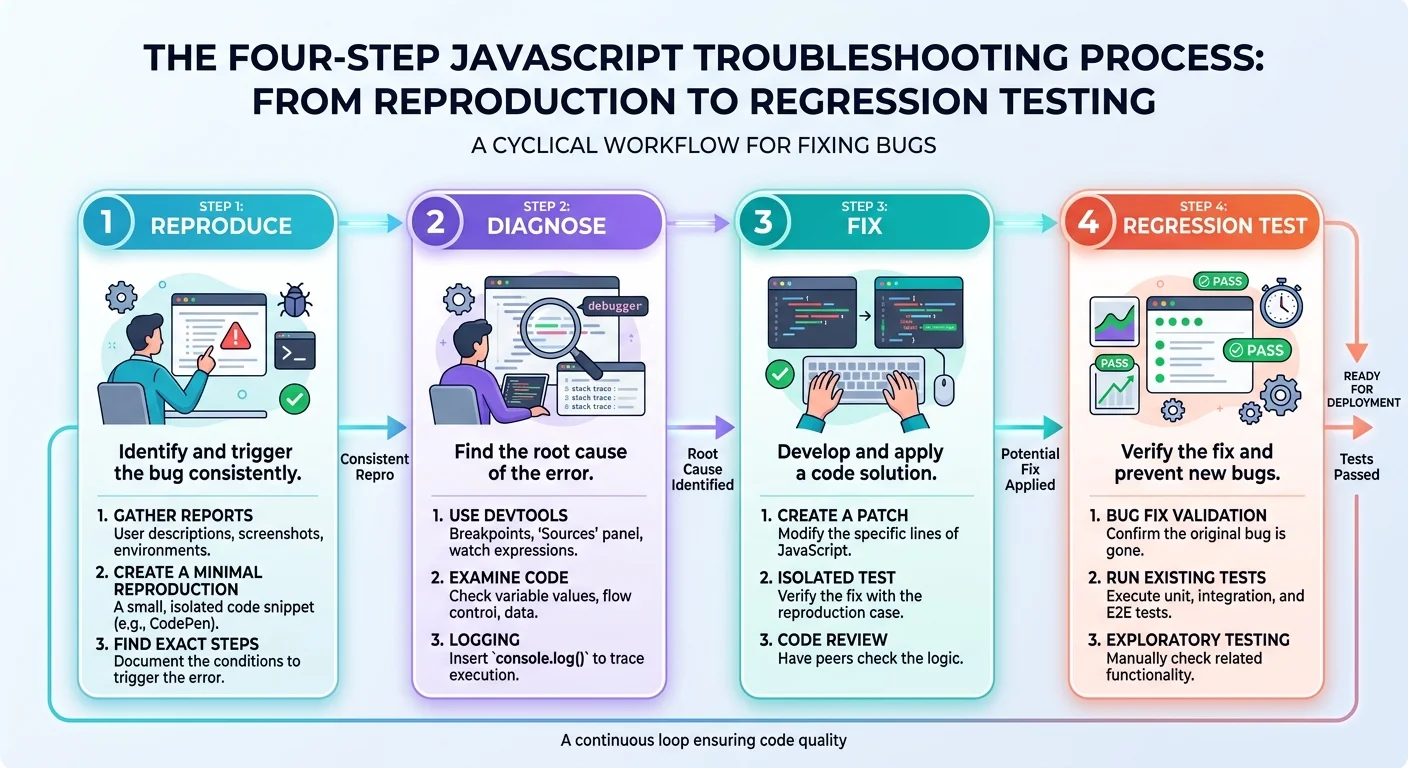
A structured approach to troubleshoot code transforms debugging from a frustrating guessing game into a systematic, almost mechanical process. Reproduce, isolate, inspect with proper tools, then fix and verify. Each step builds on the last, and skipping any of them usually costs more time than it saves.
The techniques in this guide work for vanilla JavaScript, React, Node.js, and virtually any framework built on the language. Make this process a habit, and you'll find that the bugs you once dreaded become straightforward puzzles with clear solutions.
Disclaimer: Portions of this content may have been generated using AI tools to enhance clarity and brevity. While reviewed by a human, independent verification is encouraged.