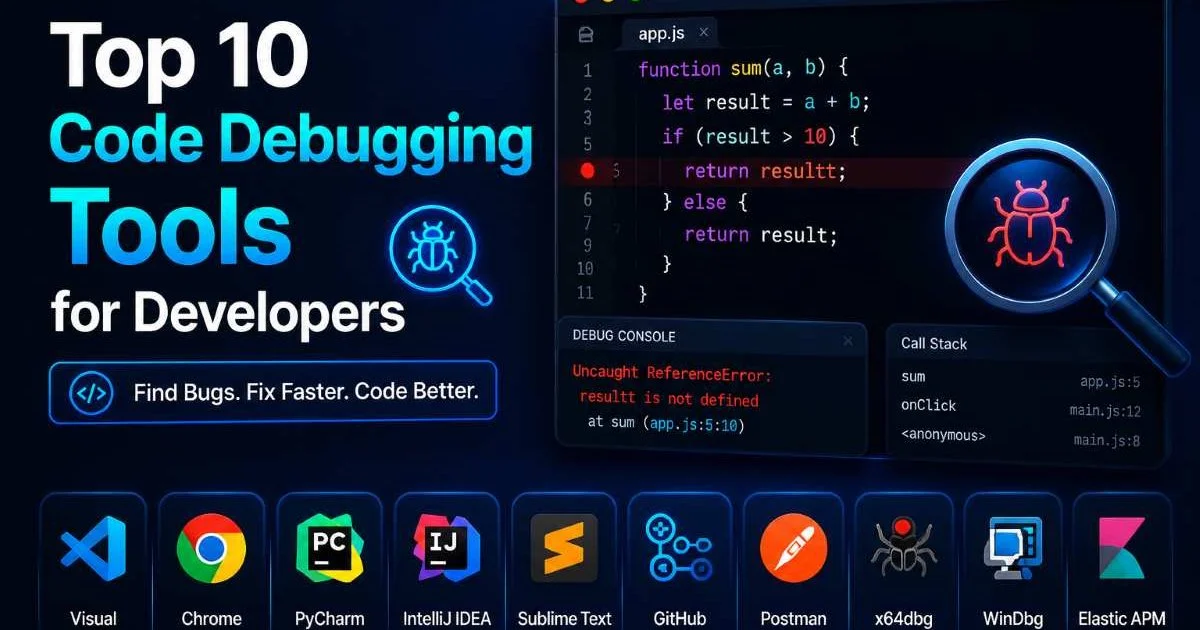
Code debugging tools are the backbone of productive software development. Whether you're tracking down a misplaced semicolon or chasing a race condition across microservices, the right tools can cut your troubleshooting time from hours to minutes.
For beginners, the sheer number of options can feel overwhelming. For mid-level developers, the question shifts from "what exists" to "what fits my workflow best."
This article ranks ten of the most effective debugging tools available today and explains what makes each one worth your attention. Understanding how code debugging works is the first step, but selecting the right toolset is what separates efficient developers from frustrated ones.
Key Takeaways
- Browser DevTools remain the fastest way to debug frontend JavaScript and CSS issues.
- VS Code's built-in debugger supports breakpoints, watch expressions, and multi-language debugging.
- GDB and LLDB are indispensable for C and C++ developers working close to hardware.
- Postman and Charles Proxy help isolate bugs at the API and network layer.
- Choosing code debugging tools that match your language and workflow prevents wasted effort.
Browser and Frontend Debugging Tools
Chrome DevTools
Chrome DevTools ships with every installation of Google Chrome and remains the most widely used frontend debugging environment. The Elements panel lets you inspect and modify the DOM in real time, while the Console panel provides immediate access to JavaScript errors, warnings, and log output. The Sources panel supports breakpoints, conditional breakpoints, and step-through execution, which makes it possible to trace complex logic without scattering console.log statements throughout your code.
Performance profiling is another area where Chrome DevTools excels. The Performance tab records CPU activity, rendering events, and memory allocation over time, giving you a clear picture of bottlenecks. The Lighthouse audit tool, built directly into DevTools, generates actionable reports on page speed, accessibility, and SEO. For frontend developers, this is often the first and most important stop when something goes wrong.
The Network panel deserves its own mention. It logs every HTTP request, shows headers, payloads, and response times, and lets you throttle network speed to simulate slow connections. If you're working with REST APIs or loading third-party scripts, this panel will reveal timing issues and failed requests that are invisible in the UI. Chrome DevTools is a non-negotiable tool in any frontend developer's kit.
Firefox Developer Tools
Firefox Developer Tools offer a comparable feature set to Chrome DevTools but include a few distinctive strengths. The CSS Grid and Flexbox inspectors are best-in-class, providing visual overlays that show exactly how layout algorithms distribute space. Firefox also includes a robust accessibility inspector that highlights ARIA roles, tab order, and contrast ratios. Developers who build design-heavy or accessibility-focused applications often prefer Firefox's tooling for these specific tasks.
Use Firefox's CSS Grid inspector alongside Chrome DevTools to catch layout bugs that appear only in one rendering engine.
IDE-Integrated Code Debugging Tools
Visual Studio Code Debugger
Visual Studio Code has become the most popular code editor in the world, and its integrated debugger is a major reason why. It supports breakpoints, watch expressions, call stack inspection, and variable hovering across dozens of languages through extensions. Node.js debugging works out of the box. For Python, Java, Go, and other languages, you install the relevant extension and configure a launch.json file to define your debug targets.
The real power of VS Code's debugger lies in its extensibility and multi-target support. You can debug a frontend React application and a backend Node.js server simultaneously by configuring compound launch configurations. This eliminates the painful context switching that happens when you run separate debugging sessions. VS Code also integrates with Docker containers and remote SSH sessions, so you can debug code running on a different machine as if it were local. For developers who follow coding best practices, VS Code's linting and debugging integration creates a tight feedback loop.
JetBrains Debugger Suite
JetBrains IDEs like IntelliJ IDEA, PyCharm, and WebStorm include some of the most polished debuggers available. These tools go beyond basic breakpoints with features like evaluate expression windows, object rendering, and memory snapshots. IntelliJ's Java debugger, for example, supports hot code replacement, which lets you modify code during a debug session without restarting the application. PyCharm offers similar convenience for Python, including Django and Flask template debugging.
The cost of a JetBrains license is justified by the time savings. Their debuggers understand framework-specific patterns, so they can display Spring beans, SQLAlchemy models, or React component trees in structured, readable formats. If you're working primarily in one language ecosystem and want the deepest possible debugging experience, a JetBrains IDE is hard to beat.
"The best code debugging tools don't just show you what went wrong; they help you understand why it happened."
Xcode Debugger
Apple's Xcode includes LLDB as its default debugger, paired with a graphical interface tailored for iOS and macOS development. The View Debugger lets you visualize the entire view hierarchy in 3D, making it straightforward to identify overlapping views or misplaced constraints. Memory Graph Debugger identifies retain cycles and leaked objects, which are among the most common bugs in Swift and Objective-C applications. For anyone building Apple platform software, Xcode's debugging tools are essential.
| Tool | Primary Languages | Hot Reload | Remote Debugging | Free Tier |
|---|---|---|---|---|
| VS Code | JavaScript, Python, Go, C++ | Limited | Yes | Yes |
| IntelliJ IDEA | Java, Kotlin, Scala | Yes | Yes | Community Edition |
| PyCharm | Python | Yes | Yes | Community Edition |
| WebStorm | JavaScript, TypeScript | Yes | Yes | No |
| Xcode | Swift, Objective-C | Limited | Yes (devices) | Yes |
Command-Line and System-Level Debuggers
GDB (GNU Debugger)
GDB has been the standard debugger for C and C++ programs on Linux for decades. It operates entirely from the command line, which gives it an initial learning curve, but the payoff is immense control. You can set breakpoints on specific memory addresses, inspect register values, disassemble functions, and even modify variables at runtime. GDB also supports remote debugging through gdbserver, which is critical for embedded systems development where you can't run a full IDE on the target device.
Modern GDB includes Python scripting support, allowing developers to write custom pretty printers and automation scripts. If you regularly debug segmentation faults, buffer overflows, or undefined behavior in C/C++ codebases, GDB is irreplaceable. Tools like Valgrind complement GDB by detecting memory leaks and invalid memory access patterns that GDB alone might miss during casual inspection.
GDB can modify program state during debugging. Be cautious with production binaries and always work on debug builds with symbols enabled.
LLDB
LLDB is the debugger component of the LLVM project and serves as the default debugger on macOS and in Xcode. It shares many commands with GDB but adds better Unicode support, a plugin architecture, and tighter integration with Clang's compiler diagnostics. LLDB's expression evaluator can run arbitrary C, C++, Objective-C, and Swift code at a breakpoint, which makes it exceptionally powerful for exploratory debugging. Developers transitioning from GDB will find the command syntax familiar but slightly different.
PDB (Python Debugger)
Python's built-in PDB module is lightweight, requiring no installation and no configuration. You insert a single line (import pdb; pdb.set_trace()) at the point where you want to pause execution, and PDB drops you into an interactive shell. From there, you can step through code, inspect variables, evaluate expressions, and navigate the call stack. For quick debugging sessions, PDB is faster than launching a full IDE debugger, especially when you're working over SSH on a remote server.
Enhanced alternatives like ipdb and pdb++ add syntax highlighting, tab completion, and better stack trace formatting. These drop-in replacements keep PDB's simplicity while addressing its rough edges. Python developers who understand PDB can debug effectively in any environment, from local development to production containers. Knowing when to reach for PDB versus a GUI debugger is a skill that comes with experience and saves real time on complex projects.
In Python 3.7 and later, you can use the built-in breakpoint() function instead of importing pdb directly.
Network and API Debugging Tools
Postman
Postman started as a simple HTTP client for testing API endpoints and has grown into a full collaboration platform. You can define collections of API requests, add pre-request scripts and test assertions, and share everything with your team through Postman workspaces. When a bug manifests as unexpected API behavior, Postman lets you isolate the problem by sending precise requests with controlled headers, body content, and authentication tokens. This approach removes the frontend from the equation entirely.
Postman's Monitor feature runs collections on a schedule and alerts you when assertions fail, functioning as a lightweight API health check. The mock server feature lets frontend teams work against simulated endpoints before the backend is ready. For teams practicing continuous integration, Postman's CLI tool (Newman) runs collections in CI/CD pipelines, catching API regressions before they reach production. Understanding how to audit your API dependencies is also valuable; resources like code audit tools for license risk can complement your debugging workflow with security and compliance checks.
Create a Postman environment for each deployment stage (development, staging, production) to avoid accidentally sending test data to live servers.
Charles Proxy
Charles Proxy sits between your application and the network, intercepting all HTTP and HTTPS traffic for inspection. This is particularly useful for debugging mobile applications, where browser DevTools aren't available. You can view request and response bodies, modify them on the fly using breakpoints, and throttle bandwidth to simulate poor network conditions. Charles also supports SSL proxying, which lets you decrypt HTTPS traffic from your own devices during debugging.
One of Charles Proxy's strongest use cases is reproducing intermittent bugs caused by specific server responses. You can record a session, save it, and replay modified responses to test how your application handles edge cases like timeouts, 500 errors, or malformed JSON. Developers working on mobile apps, desktop clients, or any application that communicates over HTTP will find Charles Proxy fills a gap that code debugging tools within IDEs simply don't cover. It reveals problems that live in the space between your code and the services it depends on.
Final Thoughts
Picking the right code debugging tools depends on your language, platform, and the type of bugs you encounter most often.
Browser DevTools and VS Code cover most web development scenarios. GDB, LLDB, and PDB serve developers working in systems programming and scripting. Postman and Charles Proxy address the network layer, where many subtle bugs hide. Start with the tools that match your daily work, learn their advanced features, and expand your toolkit as your projects grow more complex.
Disclaimer: Portions of this content may have been generated using AI tools to enhance clarity and brevity. While reviewed by a human, independent verification is encouraged.