To debug and fix code errors means to systematically analyze your program's behavior, locate the source of unexpected outcomes, and apply corrections that restore intended functionality. This process sits at the heart of every developer's daily workflow, whether you're building a simple landing page or architecting a complex backend system. The ability to troubleshoot code issues effectively separates productive programmers from those who spend hours staring at screens in frustration.
Errors are inevitable in software development; what matters is your approach to resolving them. Understanding the full cycle of code error analysis, from reading stack traces to validating fixes, builds a foundation that accelerates your growth as a developer. When you debug and fix code errors with a structured methodology, you spend less time guessing and more time shipping working software. The stakes are real: unresolved bugs cost businesses billions annually, erode user trust, and create technical debt that compounds over time.
This article breaks down what this process actually looks like, why it matters, and how you can get better at it starting today.
Key Takeaways
- Debugging is a structured skill you can learn, not an innate talent reserved for senior engineers.
- Reading error messages carefully resolves the majority of common bugs without additional tools.
- Reproducing a bug reliably is the single most important step before attempting any fix.
- Automated testing catches regressions early and prevents the same bug from returning twice.
- Code reviews from peers help identify broken logic that the original author often overlooks.

What Debugging Actually Means and How It Works
The Anatomy of a Bug
A bug is any behavior in software that deviates from what the programmer intended or what the user expects. Bugs come in many forms: a misspelled variable name, a loop that runs one time too many, or an API call that fails silently. Understanding that bugs have different root causes is the first step toward becoming effective at code error analysis. Not every problem looks the same, and the fix for a syntax error is very different from the fix for a race condition in asynchronous code.
The term "debugging" originated in the 1940s when engineers found an actual moth stuck in a relay of the Harvard Mark II computer. Today, the concept has evolved far beyond physical hardware. Modern debugging encompasses reading compiler messages, inspecting runtime state, tracing execution paths, and validating assumptions about how data flows through a system. Coding is used across virtually every industry, which means bugs appear in medical devices, financial systems, games, and everything in between.
The Debugging Workflow
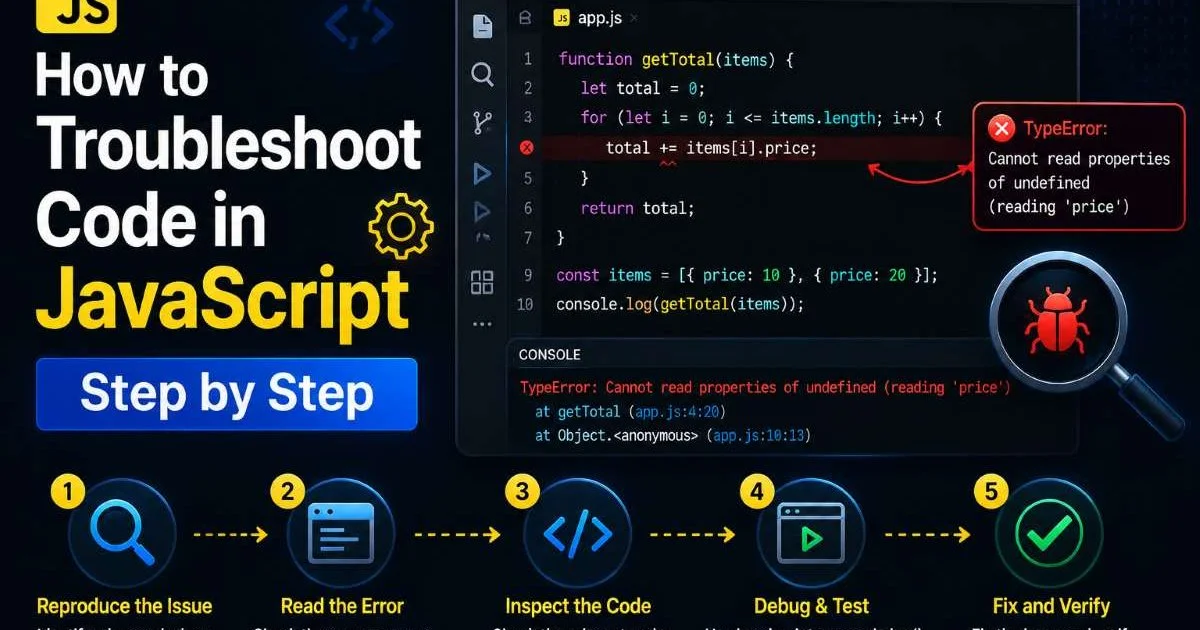
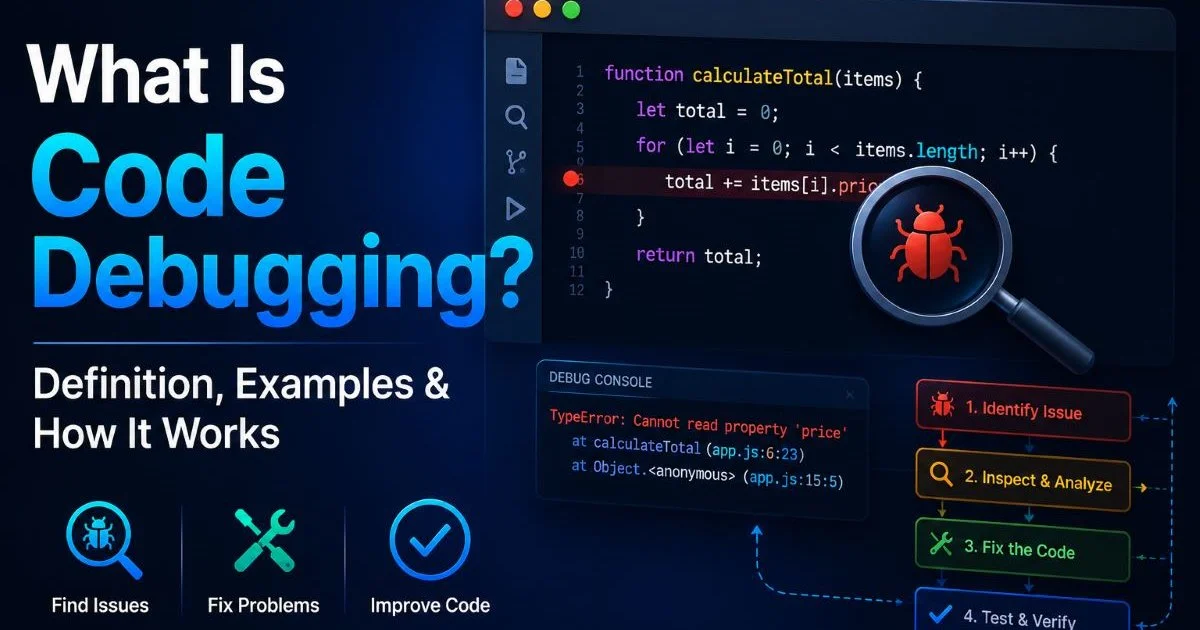
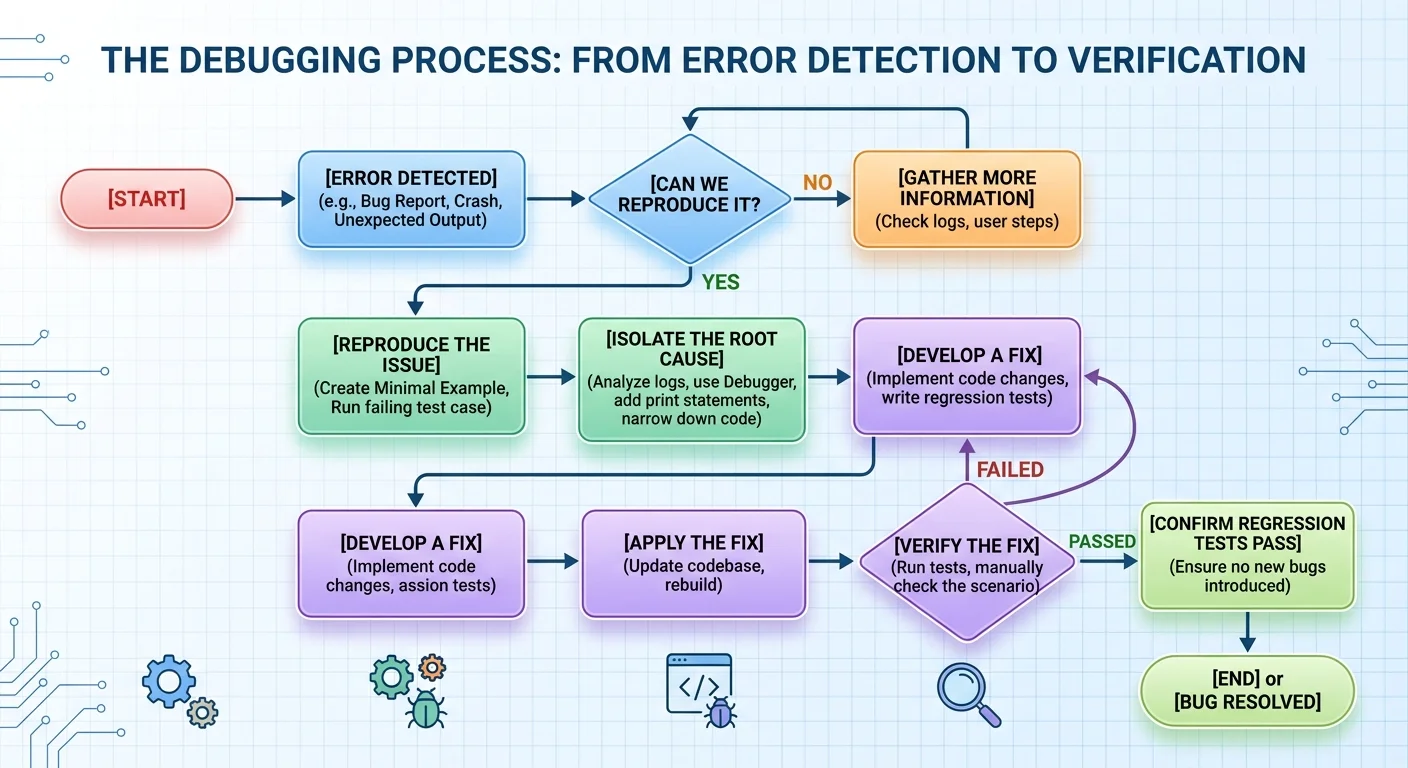
The standard workflow to debug and fix code errors follows a predictable pattern. First, you observe the symptom: a crash, wrong output, or unexpected behavior. Next, you reproduce the issue consistently so you can test potential fixes. Then you isolate the problem by narrowing down which section of code is responsible. Finally, you apply a fix and verify it resolves the issue without introducing new problems.
Always reproduce the bug before writing a single line of fix code. A fix you cannot verify is just a guess.
This cycle often repeats multiple times for complex bugs. You might think you've isolated the problem, only to discover the real cause is two layers deeper. Patience matters here. Experienced developers know that rushing to a solution often wastes more time than methodically stepping through each phase. Logging, breakpoints, and print statements are your allies during isolation, not signs of weakness or inexperience.
Why Fixing Code Errors Matters More Than You Think
The Business Impact
Unresolved code bugs carry real financial weight. A 2020 report from the Consortium for Information and Software Quality estimated that poor software quality cost the U.S. economy over $2.08 trillion in a single year. That figure includes operational failures, unsuccessful IT projects, and technical debt accumulated from deferred bug fixes. When you troubleshoot code issues quickly and thoroughly, you directly reduce these costs for your team and organization.
Beyond raw dollars, bugs destroy user trust. A payment processing error, a broken checkout flow, or a data leak caused by unchecked input validation can permanently damage a brand's reputation. Users rarely give second chances to apps that lose their data or crash at critical moments. This is why companies invest heavily in quality assurance, automated testing, and dedicated debugging workflows.
Developer Growth
Your ability to identify broken logic and resolve it efficiently is one of the most marketable skills in software engineering. Hiring managers consistently rank debugging ability alongside system design as top evaluation criteria during technical interviews. Every bug you fix teaches you something about how systems fail, and that knowledge compounds. Developers who embrace debugging as a learning opportunity rather than a chore tend to advance faster in their careers.
Debugging also builds your understanding of codebases you didn't write. When you trace through unfamiliar code to find a bug, you learn the architecture, the conventions, and the edge cases that the original author considered (or missed). This makes you a more versatile contributor on any team, capable of working across modules and services with confidence.
"Every bug you fix teaches you something about how systems fail, and that knowledge compounds over time."
Common Error Types and How to Approach Them
Syntax and Runtime Errors
Syntax errors are the most straightforward category. Your compiler or interpreter catches them before the program runs, giving you a line number and description. Missing semicolons, unclosed brackets, and misspelled keywords fall here. Most modern IDEs highlight syntax errors in real time, which means these are typically the fastest bugs to resolve. Despite their simplicity, they account for a surprising share of beginner frustration.
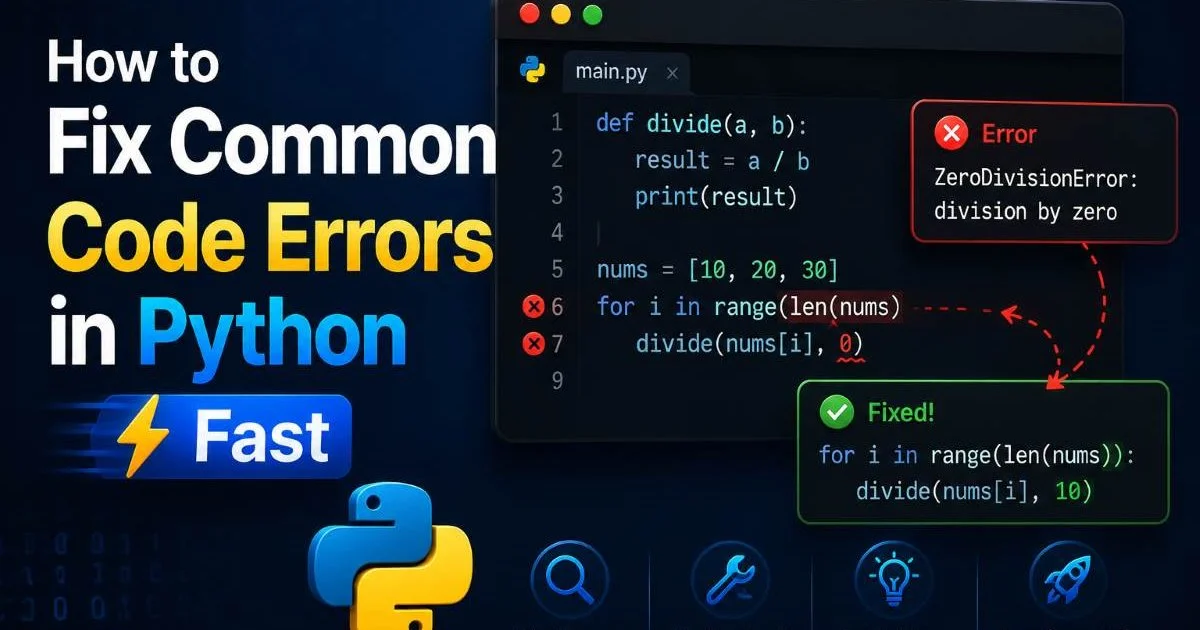
Runtime errors occur while the program executes. Null pointer exceptions, division by zero, and index-out-of-bounds errors are classic examples. These require you to understand not just the code's structure but its state at the moment of failure. Debugger tools that let you set breakpoints and inspect variables are invaluable here. When you debug and fix code errors at runtime, you're often dealing with unexpected input or edge cases your initial implementation didn't account for.
Logic Errors
Logic errors are the trickiest to find because the program runs without crashing, but produces wrong results. A sorting algorithm that almost works, a conditional statement with an inverted comparison, or an off-by-one error in a loop are all logic bugs. No error message points you to the problem. You have to compare expected output against actual output and trace backward through the code to find where the deviation begins.
| Error Type | Detected By | Difficulty | Example |
|---|---|---|---|
| Syntax | Compiler/Interpreter | Low | Missing closing parenthesis |
| Runtime | Execution failure | Medium | Accessing undefined variable |
| Logic | Manual testing | High | Incorrect loop boundary |
| Semantic | Code review | High | Using wrong algorithm entirely |
Logic errors often hide behind passing unit tests. If your tests don't cover edge cases, a logically flawed function can appear correct for months.
To identify broken logic reliably, write tests that cover boundary conditions and unusual inputs. Feed your function the smallest possible input, the largest, negative numbers, empty strings, and null values. The bugs that logic errors produce often surface only under these conditions. Following code review best practices also helps, since a fresh pair of eyes frequently spots assumptions that the original developer made unconsciously.
Tools and Practices That Improve Code Quality
Debugging Tools
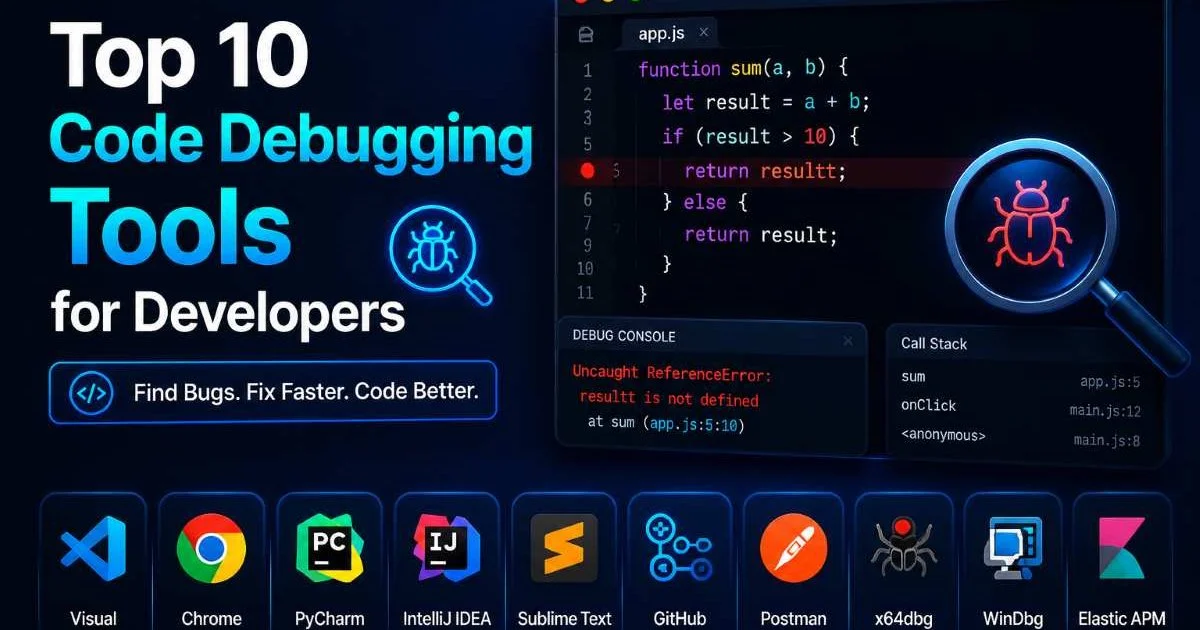
Modern development environments come packed with debugging capabilities. Chrome DevTools, Visual Studio's debugger, and PyCharm's built-in tools let you step through code line by line, inspect variable states, and evaluate expressions on the fly. Linters like ESLint and Pylint catch potential issues before you even run your code, acting as a first line of defense. These tools dramatically reduce the time needed for code bug fixes when used consistently.
AI-powered coding assistants represent a newer category of debugging support. These tools can analyze your code, suggest potential fixes, and explain error messages in plain language. Knowing what features to look for in an AI coding tool helps you choose one that genuinely accelerates your workflow rather than adding noise. The best tools integrate directly into your editor so you can debug and fix code errors without switching contexts or copying error messages into a separate browser tab.
Configure your linter to run automatically on file save. Catching errors the moment they're introduced is far cheaper than finding them in production.
Preventive Practices
The most effective way to improve code quality is to prevent bugs from entering the codebase in the first place. Writing unit tests alongside your feature code (not after) catches regressions immediately. Adopting consistent code formatting removes an entire class of silly mistakes. Pair programming and code reviews add human verification layers that automated tools cannot replicate, since they catch misunderstandings of business requirements and architectural missteps.
Version control discipline also plays a significant role. Making small, focused commits with descriptive messages makes it far easier to use git bisect or similar tools to pinpoint exactly when a bug was introduced. If your commits are large and unfocused, finding the offending change becomes a needle-in-a-haystack problem. Combine this with continuous integration pipelines that run your test suite on every push, and you create a safety net that catches issues before they reach users.
Never push a fix to production without running the full test suite. A "small" change can cascade into failures across unrelated modules.
Documentation deserves mention too. When you document why a piece of code exists (not just what it does), future developers can understand intent and avoid introducing logic errors during modifications. Comments that explain business rules, edge case handling, and known limitations save hours of debugging time for the next person who touches that code, which might be you six months from now.
Final Thoughts
Learning to debug and fix code errors is a skill that grows with deliberate practice, not just raw experience. Every bug you encounter is a puzzle that sharpens your understanding of how software actually behaves versus how you expect it to behave. Start by reading error messages carefully, reproduce issues consistently, and build habits around testing and code review.
The tools and techniques described here are accessible to developers at every level. Commit to improving your debugging process, and you'll find that the time you spend fighting your code steadily decreases while the quality of what you ship steadily rises.
Disclaimer: Portions of this content may have been generated using AI tools to enhance clarity and brevity. While reviewed by a human, independent verification is encouraged.